A star schema is the ideal tool for quickly analyzing large amounts of data. The star schema is also called a star model or dimensional model.
While developing a star schema, we divide the data into facts and dimensions. This gives us a clear model that is ideally suited for use in tools such as Power BI. Within Power BI it is even best practice to let a star model be the basis for reports.
What is a fact and what is a dimension?
A fact is a data point which equals a measurement value, with which you can calculate & aggregate. Suppose you have the following business question (and thus data): Give me the number of products and sales price for the past year at the weekly level by category. Then the number of products and sales price are facts in this example.
The ways you want to look at this data, also called the angles, are the dimensions. So in the above example, a week dimension and product category dimension. So now you can see your number of products and selling price by week, by category or by week & category.
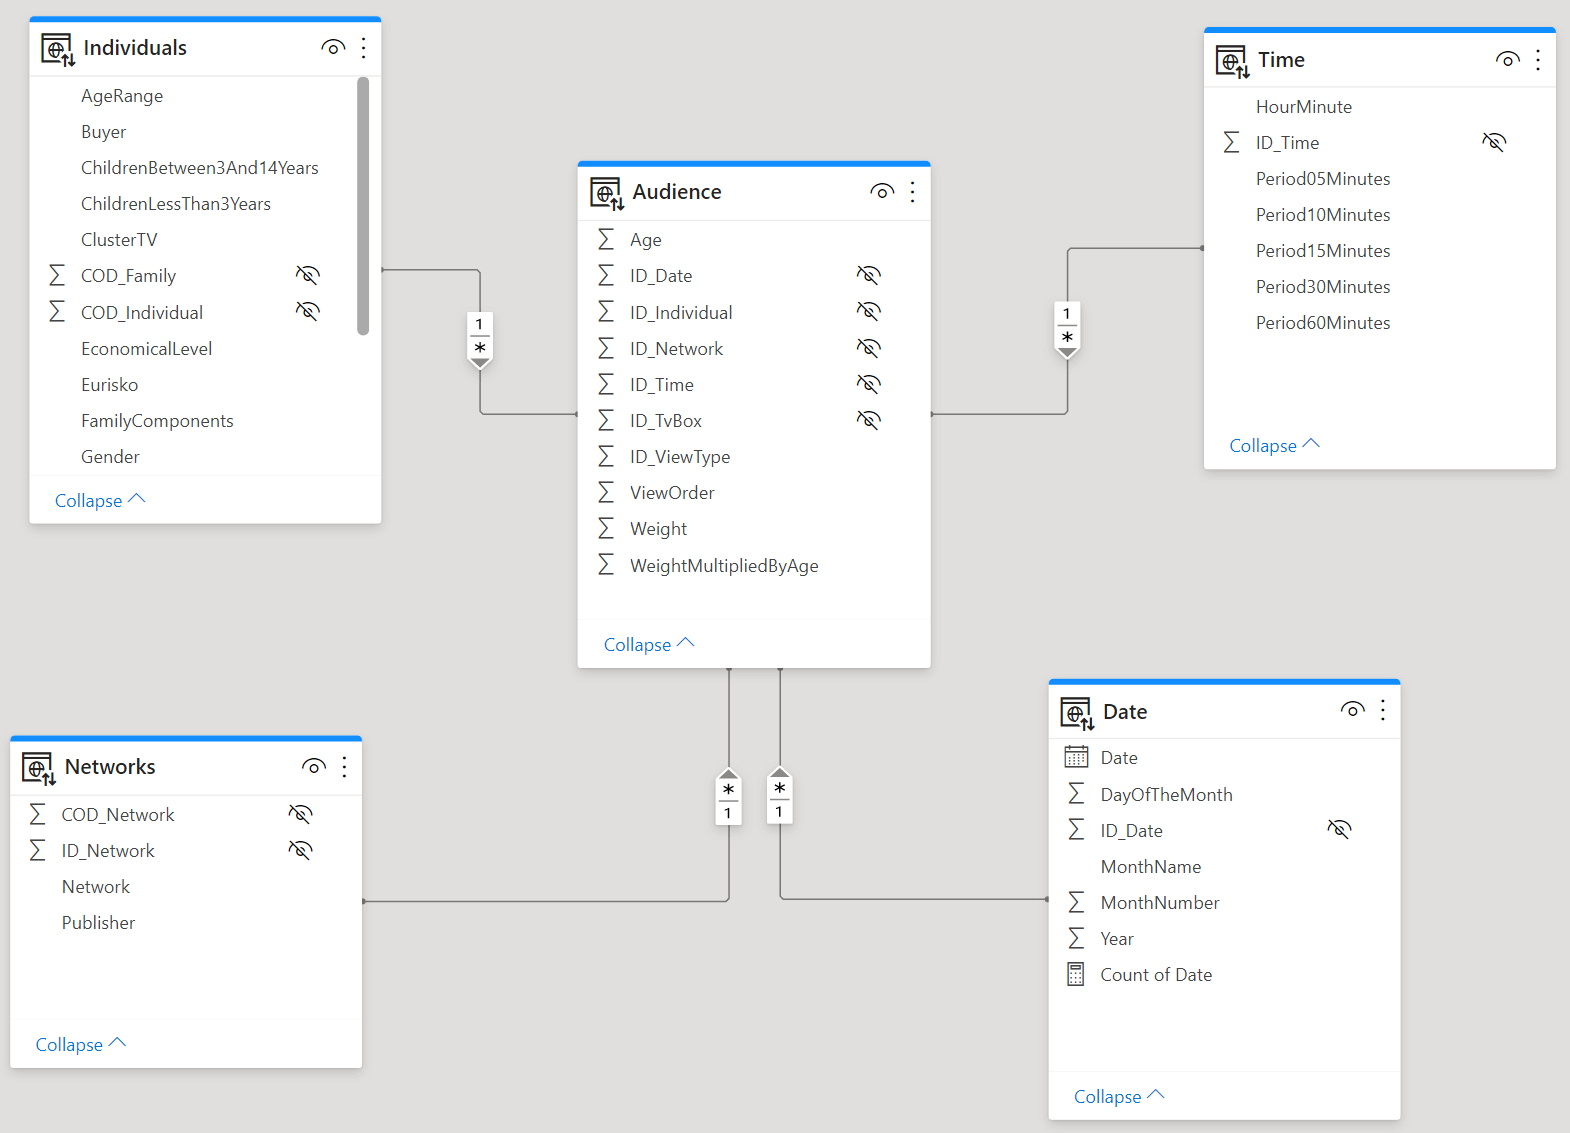
It’s called a star diagram because a fact table is surrounded by multiple dimensions, giving it the shape of a star, as you can see below.
share post